Lesson 3.1: Sampling Variability
Software Lab 3.1 Solutions
- Answers will vary, but on average there should be close to 10 “doesn’t benefit” responses and 40 “benefits” responses. These sample proportions should be close to the population proportions of 0.2 and 0.8, respectively.
- The sample proportion will generally not match the sample proportion of another random sample from this population, but the proportions should be somewhat similar.
- The sample proportion for
sample2should be quite similar to that ofsample1. A sample of size 1,000 would provide a more accurate estimate of the population proportion than a sample of size 100. - The distribution is roughly symmetric (Fig. 1), although there is a small amount of right skew. The centre is around 0.2 (mean 0.199, median 0.200), and the standard deviation is 0.0567.
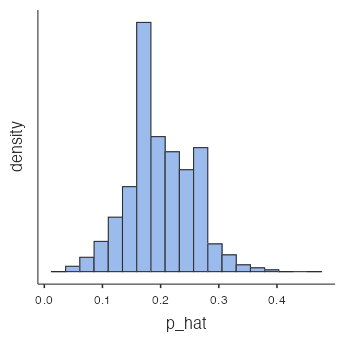
Figure 1: Histogram sampling distribution of a proportion p_hat - There are 25 observations in this distribution, each of which represents the sample proportion in a sample of size 10.
- Each observation in the sampling distribution represents an estimate of the population proportion. As the sample size increases, the mean stays the same, the standard error decreases, and the shape of the sampling distribution becomes less right-skewed, more symmetric, and narrower (more closely distributed around the mean). The mean, standard error, and shape of the sampling distribution do not really change if the number of samples is increased.
- Answers will vary, but on average the proportion of people in this sample who believe scientists’ work benefits people like them should be close to 0.8.
- The distribution is slightly left-skewed with a mean around 0.8, which is our best estimate of the true proportion of those who believe scientists’ work benefits people like them. The true population proportion is 0.8.
- The distribution becomes more symmetric and narrower (smaller standard error) with a mean still around 0.8, which is still our best estimate of the true proportion of those who believe scientists’ work benefits people like them.
- The sampling distribution from question 9 has a smaller spread, which would be preferred if we’re concerned with making estimates that are more often close to the true value.
