Lesson 4.2: Testing Goodness of Fit in One-way Tables
Software Lab 4.2 Solutions
- The expected frequencies are each 100, so they are all at least five.

 .
.1 - pchisq(7.58, df=5)≈ 0.181. Since p-value , there is insufficient evidence to reject the null hypothesis. The data support the claim that the die is fair.
- The test statistic and p-value match:
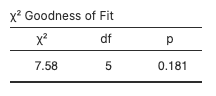
Figure 1: Chi-square goodness -of-fit test - The expected frequencies are 742, 338, 154, 70, 32, and 14.
- The expected frequency for 7+ days is 12.
- The expected frequencies are all at least five.

 .
.1 - pchisq(4.54, df=6)≈ 0.604. Since p-value , there is insufficient evidence to reject the null hypothesis. The data support the claim that trading days are independent.
- The test statistic and p-value match:
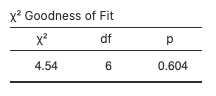
Figure 2: Chi-square goodness-of-fit test
