Lesson 4.3: Testing Independence in Two-way Tables

Lesson Learning Objectives
- Check the conditions needed for a chi-square test of independence.
- Carry out a chi-square test of independence.
Lesson 4.3 Checklist
| Learning activity | Graded? | Estimated time |
|---|---|---|
| Read OpenIntro Statistics section 6.4 and supplementary notes | No | 30 mins |
| Watch instructional video | No | 15 mins |
| Answer two section check-in questions | Yes | 15 mins |
| Work through virtual statistical software lab | No | 45 mins |
| Answer two virtual statistical software lab questions | Yes | 15 mins |
| Work on practice exercises | No | 1.5 hours |
| Explore suggested websites | No | 15 mins |
| Complete and submit Unit 4 Assignment | Yes | 2 hours |
| Complete and submit the Midterm Exam | Yes | 1 hour |
Learning Activities
Readings 📖 and Instructional Video 🎦
Chi-Square Test of Independence
Read Section 6.4: Testing for Independence in Two-Way Tables in OpenIntro Statistics (Diez et al., 2019) CC BY-SA 3.0. In the last lesson, we used a chi-square goodness-of-fit test to analyze the data in a one-way table of the counts or frequencies for a single categorical variable. As you read, look-up new terminology in the Glossary and self-assess your understanding by attempting the guided practice exercises.
In this lesson, we analyze the data in a two-way table (or contingency table) of the counts or frequencies for combinations of two categorical variables. In particular, we use a chi-square test of independence between the two categorical variables.
Watch the following video, 6 4 Homogeneity and Independence in Two Way Tables (Çetinkaya-Rundel, 2018), on this topic (duration 00:11:51).
Comparing Counts: Independence
Read Supplementary Notes 4.3, which works through a goodness-of-fit chi-square test example to determine if eye colour is independent of handedness.
Lesson Check-in Questions ✍
Virtual Statistical Software Lab 💻
Work through the virtual statistical software lab: Software Lab 4.3. In this lab you’ll practice two chi-square independence tests: One is for the eye colour and handedness example in Supplementary Notes 4.3, and the other is for a survey on youth risk behaviour. As you work through the lab, answer the exercises in the shaded boxes. These exercises are not graded but the solutions are available: Software Lab 4.3 Solutions. The lab should take you no more than 45 minutes to complete.
Virtual Statistical Software Lab Questions ✍
Practice Exercises 🖊
Work on the following exercises in OpenIntro Statistics: Exercises 6.35 and 6.37 and Chapter Exercise 6.41 (Diez et al., 2019) CC BY-SA 3.0. Check your answers using these solutions (Diez et al., 2019) CC BY-SA 3.0. You’ll deepen your understanding much more effectively if you genuinely attempt the questions by yourself before checking the solutions.
Work on the WeBWorK exercises, which are linked from your Moodle course. Check your answers using the solutions provided.
Suggested Websites 🌎
- For another take on testing independence in two-way tables, have a look at this well-written online resource: Chi-Square Test of Independence | Formula, Guide & Examples (Turney, 2023).
- To practice chi-square goodness-of-fit test calculations, try this Chi-Square Test Calculator [Application] (Statistics Kingdom, n.d.). To use the calculator, make sure you’ve selected “independence (association) test,” set the significance level (
 ) to 0.05, and set the continuity correction to false.
- For the hair colour and handedness example in Supplementary Notes 4.3, “enter sample data” so that it looks like Figure 1:
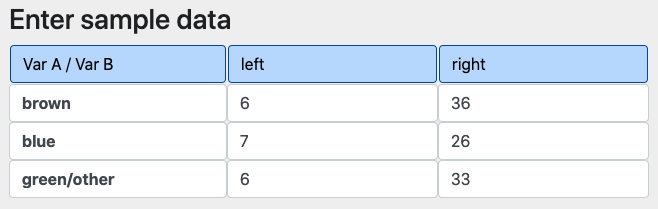
Figure 1: Eye colour handedness data Click “calculate” to see the results.
- For the iPod problem example in Section 6.4 of the textbook, “enter sample data” so that it looks like Figure 2:
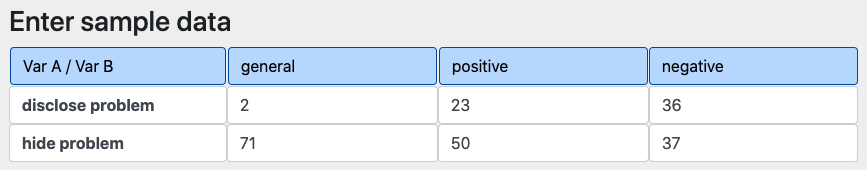
Figure 2: iPod problem data Click “calculate” to see the results.
- For the type-2 diabetes example in Section 6.4.2 of the textbook, “enter sample data” so that it looks like Figure 3:
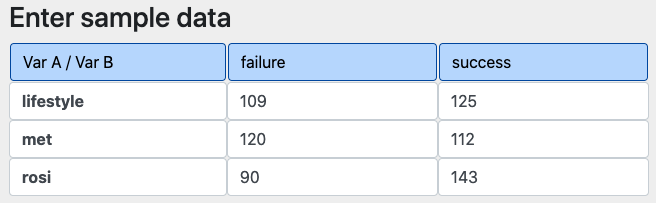
Figure 3: Type-2 diabetes data Click “calculate” to see the results.
- For the hair colour and handedness example in Supplementary Notes 4.3, “enter sample data” so that it looks like Figure 1:
Unit Assignment ✍
Midterm Exam ✍
Media Attributions
References
Çetinkaya-Rundel, M. (2018, Feb. 19). 6 4 Homogeneity and independence in two way tables [Video]. YouTube. https://www.youtube.com/watch?v=yjrsfNdja0U
Diez, D. M., Çetinkaya-Rundel, M., Barr, C. D. (2019). OpenIntro Statistics (4th ed.). OpenIntro. https://www.openintro.org/book/os/
Fred PO [Fred_78]. (2012). Rome, tables de restaurant dans le centre historique de Rome [Photograph]. Flickr. https://flic.kr/p/dDv5W3
Statistics Kingdom. (n.d.). Chi-square test calculator [Application]. https://www.statskingdom.com/310GoodnessChi.html
Turney, S. (2023, Jun. 22). Chi-square goodness of fit test | formula, guide & examples. Scribbr. https://www.scribbr.com/statistics/chi-square-goodness-of-fit/
