Lesson 5.1: Inference for One Mean or a Mean Difference from Two Paired Groups
Software Lab 5.1 Solutions
- The sample size is at least 30 and there are no particularly extreme outliers evident in the normal probability plot, so the nearly normal condition is likely satisfied.
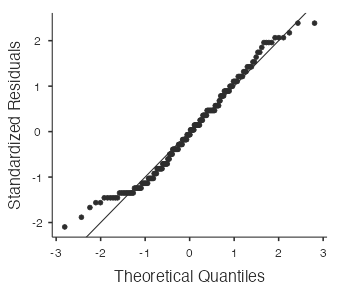
Figure 1: Normal probability plot for high school math scores  . The more accurate interval in the “One Sample T-Test” output is
  .
.
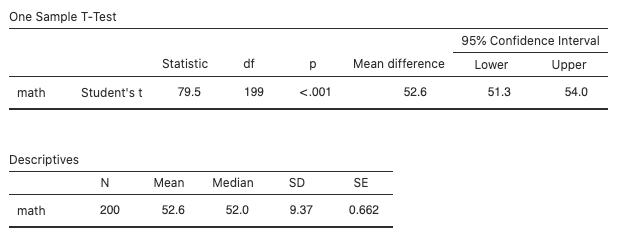
Figure 2: Confidence interval for the mean math scores - We’re 95% confident the mean standardized math score for high school seniors is between 51.3 and 54.0.
 . The more accurate test statistic in the “One Sample T-Test” output (Fig. 3) is
  .
.
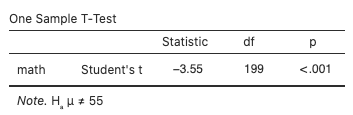
Figure 3 Hypothesis test for a mean in math scores The p-value from the code
pt(-3.55, df=199)is 0.0002, which in the “One Sample T-Test” output (Fig. 3) is shown as “<.001.”- Since p-value
 , there is sufficient evidence to reject the null hypothesis. The data support the admission officer’s belief that the mean standardized math score for high school seniors is not 55. Based on the confidence interval from question 2, the mean score appears to be less than 55.
 - The sample size is at least 30 and there are no particularly extreme outliers evident in the normal probability plot, so the nearly normal condition is likely satisfied.
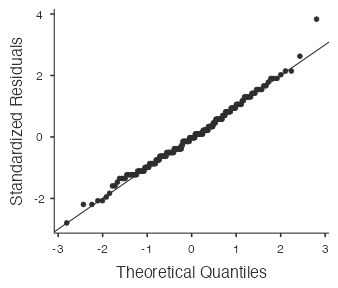
Figure 4: Normal probability plot for math and science scores  . The interval in the “Paired Samples T-Test” output (Fig. 5) is given as
  .
.
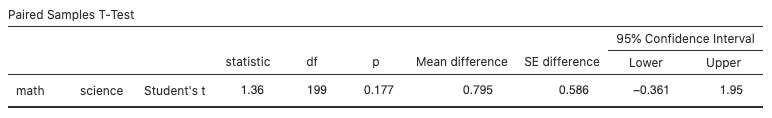
Figure 5: Confidence interval for math and science scores - We’re 95% confident the difference in the mean scores of high school seniors for math and science is between
 and
and  .
.  , which matches the value in the “Paired Samples T-Test” output (Fig. 5).
The p-value from the code2*(1-pt(1.36, df=199))is 0.175. The more accurate p-vale in the “Paired Samples T-Test” output (Fig. 5) is 0.177.- Since p-value
 , there is insufficient evidence to reject the null hypothesis. The data do not support the admission officer’s belief that the mean standardized math score for high school seniors differs from the mean standardized science score.
