Lesson 5.2: Inference for Difference in Means from Two Independent Groups
Software Lab 5.2 Solutions
- Calculated value:
 . Test output value:
  .
.
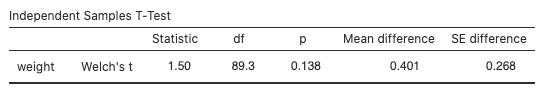
Figure 1: Independent samples t-test for ncbirths - Calculated value:
 . Test output value:
  .
.
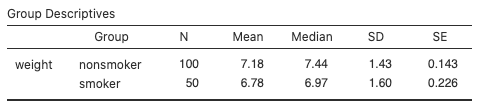
Figure 2: Group descriptives for North Carolina births data - Calculated p-value:
 . Test output value:
  .
. - The p-value is larger than the significance value, 0.05, so we do not reject the null hypothesis. There is insufficient evidence to say there is a difference in average birth weight of newborns from North Carolina mothers who did smoke during pregnancy and newborns from North Carolina mothers who did not smoke during pregnancy.
- Calculated value:
 . Test output value:
  .
.
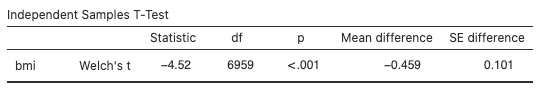
Figure 3: Independent samples t-test for BMI and activity - Calculated value:
 . Test output value:
  .
.
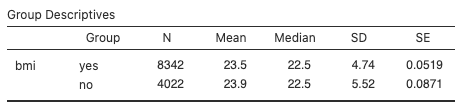
Figure 4: Group descriptives for high-schooler physical activity - Calculated p-value:
 . Test output value:
  .
. - The p-value is smaller than the significance value, 0.05, so we reject the null hypothesis in favour of the alternative hypothesis. There is sufficient evidence to say there is a difference in average body mass index of high schoolers who are physically active at least three days a week and high schoolers who are physically active two or fewer days a week.

 . The interval in the “Independent Samples T-Test” output is given as
  .
.
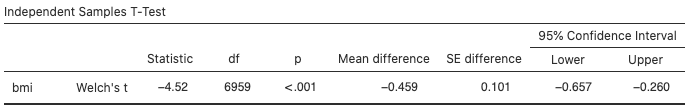
Figure 5: Independent samples confidence interval for high-schooler physical activity - We’re 95% confident the difference in average body mass index of high-schoolers who are physically active at least three days a week and high-schoolers who are physically active two or fewer days a week is between
 and
and  . Although statistically significant, this difference is probably not of much practical significance.
