Lesson 5.3: Inference for Multiple Means Using ANOVA
Software Lab 5.3 Solutions
- The summary statistics match those in the textbook:
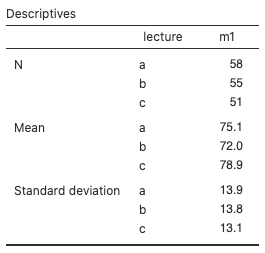
Figure 1: Group descriptives summary statistics for classdata - The variability within each group is approximately the same since the standard deviations are 13.9, 13.8, and 13.1.
- The observations within each group appear to be nearly normal based on the points lying reasonably close to the lines in the following normal probability plots (Fig. 2), with no extreme outliers.
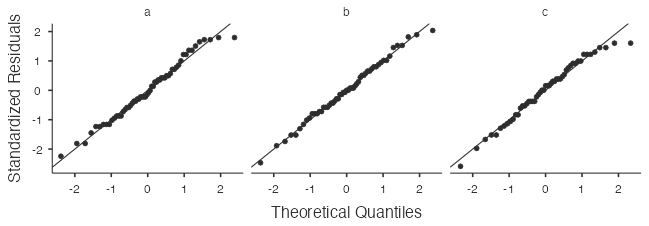
Figure 2: Normal probability plots for classdata lectures a, b, and c - The F-statistic, 3.48, and p-value, 0.033, match the values in the textbook:
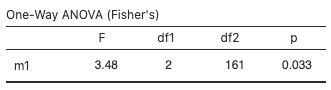
Figure 3: ANOVA F-test for classdata example - The code
1-pf(3.48, df1=2, df2=161)returns the value 0.03314. - The p-value 0.033 is less than the significance level
 , so reject H0 in favour of HA and conclude that there is sufficient evidence that at least one population mean is different.
 - The
t-valuesin the jamovi output (1.23, –1.47, and –2.64) are similar to the t-scores in the textbook (1.21, –1.46, and –2.60).
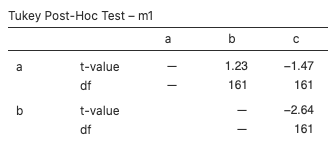
Figure 4: ANOVA post-hoc F-test for classdata lectures a, b, and c - The p-values calculated from the jamovi
t-values(0.2205, 0.1435, and 0.0091) are similar to the p-values in the textbook (0.228, 0.1462, and 0.0102). Since only the p-value for the lecture B versus lecture C comparison (0.0091) is less than the Bonferroni-corrected significance level (0.05/3 = 0.0167), only the lecture B and lecture C means differ statistically. - The adjusted p-values are 0.440, 0.308, and 0.025:
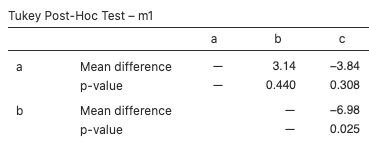
Figure 5: ANOVA post-hoc F-tests for classdata lectures a, b, and c - Since only the p-value for the lecture B versus lecture C comparison (0.025) is less than the significance level (0.05), only the lecture B and lecture C means differ statistically.
