Lesson 6.1: Linear Association Between Two Numerical Variables
Software Lab 6.1 Solutions
- Average evaluation scores range from 2.30 to 4.88 with a mean of 4.08 and a standard deviation of 0.48. Average beauty ratings range from 1.67 to 8.17 with a mean of 4.60 and a standard deviation of 1.59. Age ranges from 29 to 73 with a mean of 47.2 and a standard deviation of 10.3.
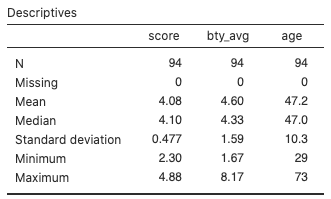
Figure 1: Descriptives summary statistics for evals_prof data - Average evaluation scores are slightly right-skewed, with the majority of average scores between about 3.6 and 4.9.
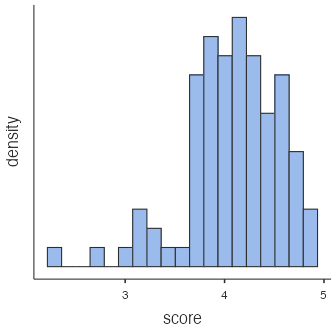
Figure 2: Histogram of professor evaluation scores Average beauty ratings are reasonably symmetric, with the majority of average ratings between about 3 and 7.
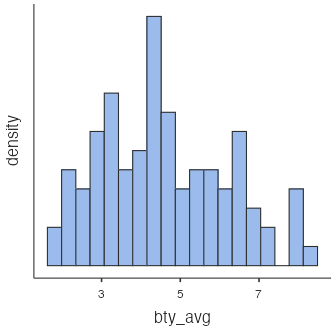
Figure 3: Histogram of evals_prof data, average beauty ratings Ages are mostly symmetric except for a couple in their seventies, with the majority of ages between 40 and 60.
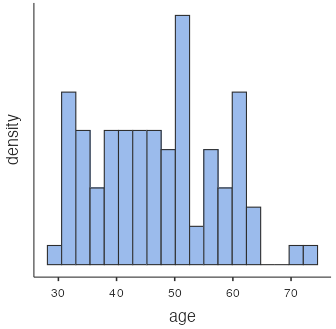
Figure 4: Histogram of evals_prof data, professor ages - There is a slight positive linear trend as the average value of
scoretends to increase asbty_avgincreases. There are a couple of points that stick-out from the overall point cloud: one withbty_avgabout 5.2 and a very low value ofscorearound 2.3, and another withbty_avgabout 1.7 andscoreabout 2.7.
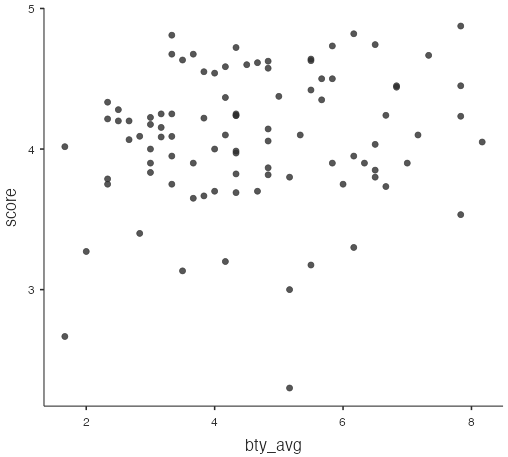
Figure 5: Scatterplot of score vs bty_avg - There isn’t much of a trend between
scoreandage, and the points seem pretty randomly scattered. There are a couple of points that stick-out from the overall point cloud: one withageabout 41 and a very low value ofscorearound 2.3, and another withageabout 60 andscoreabout 2.7. These are the same two points that stick out in question 3.
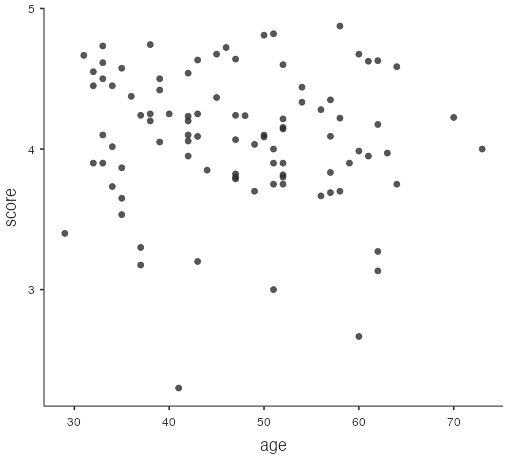
Figure 6: Scatterplot of score vs. age - The correlation between
scoreandbty_avgis likely to have a slightly higher absolute value than the correlation betweenscoreandagesince there is a slightly stronger linear relationship betweenscoreandbty_avgthan betweenscoreandage. - The correlation for
scoreandbty_avg(0.156) has a greater absolute value than the correlation forscoreandage(–0.080). - The correlation for
scoreandbty_avgdecreases to 0.131, while the correlation forscoreandageis almost unchanged at –0.075. - The linear regression line has a positive slope (correlation is positive), but it is not particularly steep (correlation is close to zero).
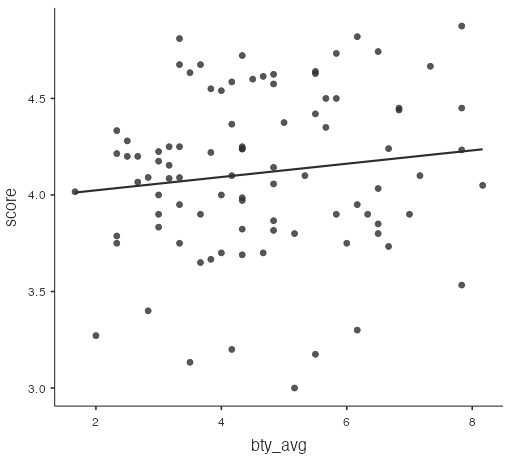
Figure 7: Scatterplot of score vs. bty_avg has a linear, positive slope regression line - The linear regression line has a negative slope (correlation is negative), but it is almost horizontal (correlation is very close to zero).
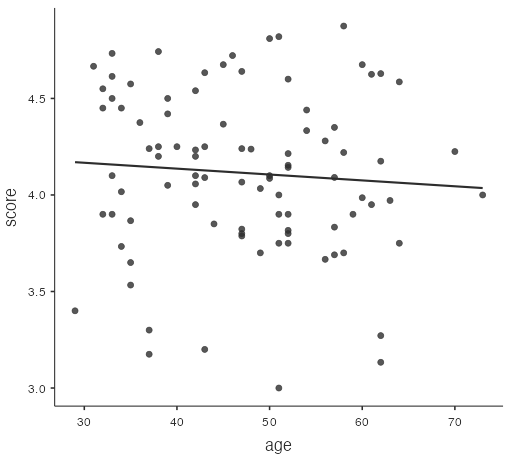
Figure 8: Scatterplot of score vs. age has a linear, negative slope regression line - The variable
bty_avgwould produce slightly more accurate predictions ofscoreon average, since there is a slightly stronger linear relationship betweenscoreandbty_avgthan there is betweenscoreandage.
