Lesson 6.2: Simple Linear Regression
Software Lab 6.2 Solutions
- Personal freedom scores range from 2.17 to 9.40 with a mean of 6.98 and a standard deviation of 1.49. Media control ratings range from 0.75 to 9.75 with a mean of 5.02 and a standard deviation of 2.32. Security and safety ratings range from 3.96 to 9.96 with a mean of 8.07 and a standard deviation of 1.42.
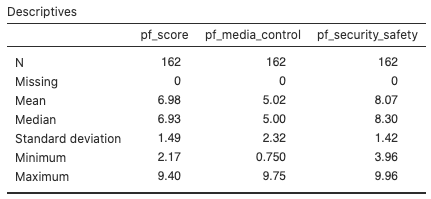
Figure 1: Descriptives table in jamovi for personal freedom data Personal freedom scores (Fig. 2) are slightly right-skewed, with the majority of scores between about 5 and 9.5.
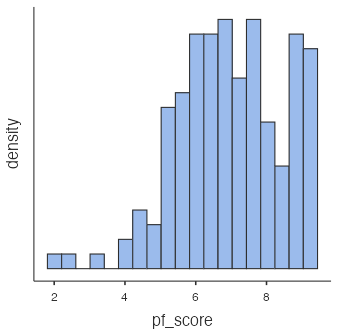
Figure 2: Personal freedom scores (pf_score) Media control ratings (Fig. 3) are reasonably symmetric, with the majority of ratings between about 2.5 and 7.5.
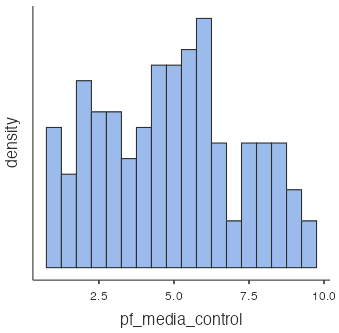
Figure 3: Media control ratings Security and safety ratings (Fig. 4) are somewhat right-skewed, with the majority of ratings between about 7 and 10.
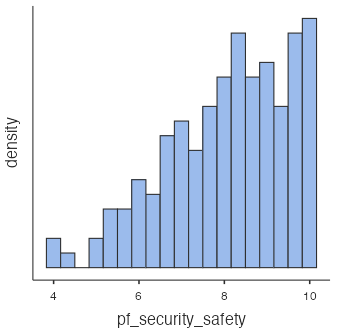
Figure 4: Security and safety ratings - There is a strong negative linear trend (Fig. 5) as the average value of
pf_scoretends to decrease aspf_media_controlincreases. There are three points with very low values ofpf_scoreand high values ofpf_media_controlthat stick out slightly from the overall point cloud.
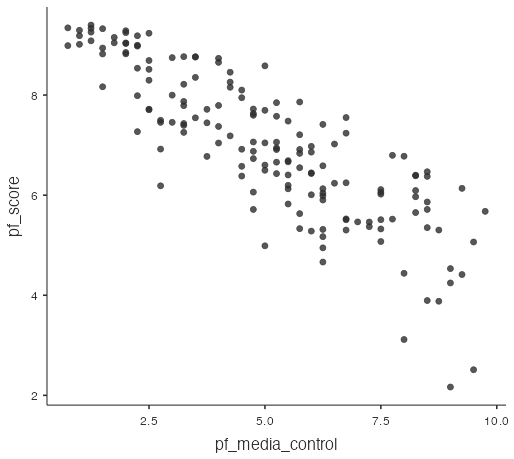
Figure 5: Scatterplot of pf_media_control vs pf_score data - The linear regression line (Fig. 6) has a negative slope and is quite steep. There is a relatively large decrease in average
pf_scorefor each unit increase inpf_media_control.
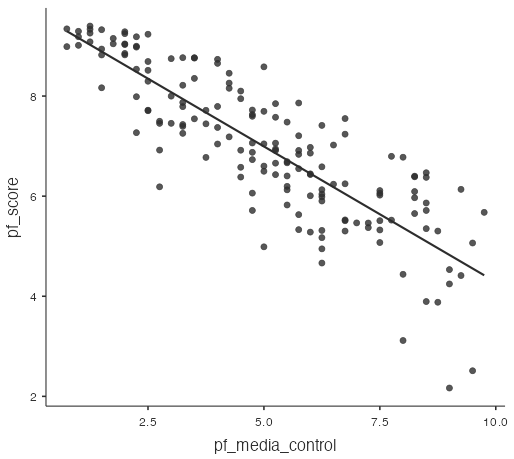
Figure 6: Scatterplot with negative-slope regression line for pf_score vs pf_media_control data - There is no apparent pattern in the residuals plot (Fig. 7), which indicates it is reasonable to assume a linear relationship between the two variables.
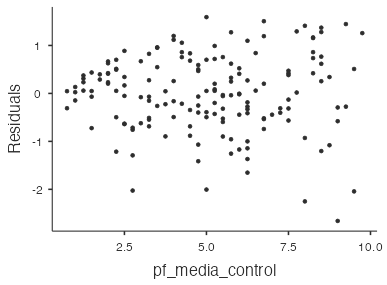
Figure 7: Scatterplot of residuals vs. pf_media_control data - The majority of the points (Fig. 8) lie close to the diagonal line in the normal probability plot with no extreme outliers, which indicates that the nearly normal residuals condition is not violated.
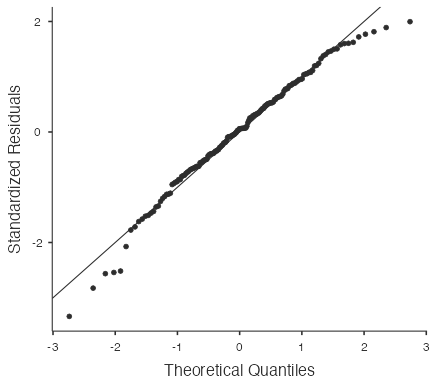
Figure 8: Normal probability plot for pf_score vs. pf_media_control data - The variability of the residuals in the “Residuals vs
pf_media_control” plot in question 4 (see Fig. 7) appear reasonably constant across the plot, which indicates that the constant variability condition is not violated. The slight decreases in residual variability for low values ofpf_media_controlon the left of the plot is not extreme enough to be concerned about. - There is a fairly strong positive linear trend as the average value of
pf_scoretends to increase aspf_security_safetyincreases (Fig. 9). The linear regression line has a positive slope and is fairly steep (averagepf_scoreincreases a fair amount for each unit increase inpf_security_safety).
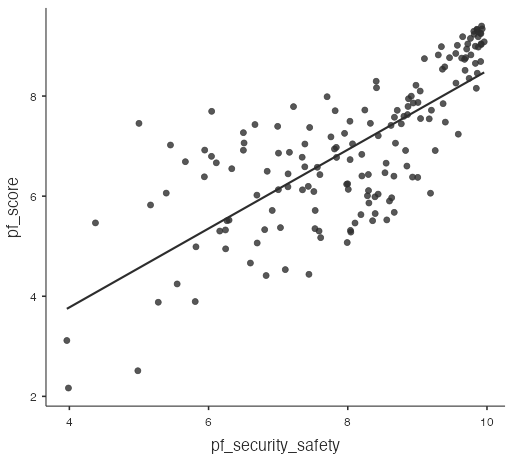
Figure 9: Scatterplot with positive-slope regression line for pf_score vs. pf_security_safety data  .
.
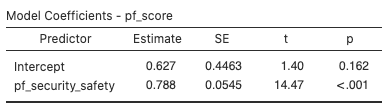
Figure 10: Model coefficients table for pf_score data - 56.7% of the variability in
pf_scoreis explained bypf_media_control.
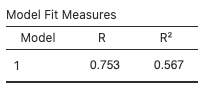
Figure 11: Model fit measures table for pf_score vs. pf_security_safety data - The predictor
pf_media_controlshould produce more accurate predictions ofpf_scoreon average because there is a stronger linear association betweenpf_scoreandpf_media_control(see question 3) than betweenpf_scoreandpf_security_safety(see question 7) and because the value of R2 is higher for the linear regression model withpf_media_control(71.4%) than the linear regression model withpf_security_safety(56.7%).
