Lesson 6.3: Multiple Linear Regression
Software Lab 6.3 Solutions
- Males tend to receive slightly higher evaluation scores, although there is a lot of overlap. Scores for males range from 2.67 to 4.88 with a mean of 4.17 and a standard deviation of 0.423. Scores for females range from 2.30 to 4.74 with a mean of 3.96 and a standard deviation of 0.523.
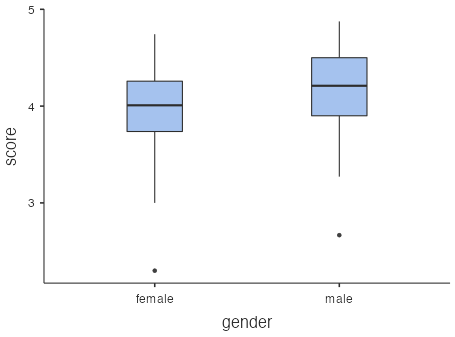
Figure 1: Boxplots showing score by gender: (left) female results, (right) male results  .
.
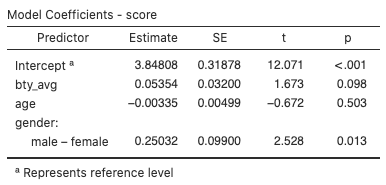
Figure 2: Model coefficients for professor evaluation - Adjusted R2 is 0.0597.
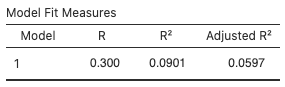
Figure 3: Model fit measures for adjusted R2 - One predictor,
gender(p-value = 0.013), has a significant coefficient at the 0.05 significance level and two predictors,bty_avg(p-value = 0.098) andage(p-value = 0.503), do not.  .
.
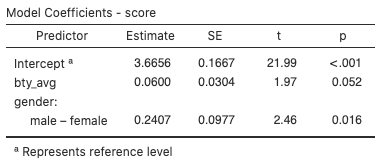
Figure 4: Model coefficients for professor evaluation model - Adjusted R2 has increased to 0.0654.
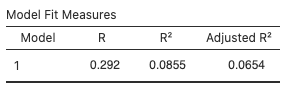
Figure 5: Model fit measures for adjusted R2 - One predictor,
gender(p-value = 0.016), has a significant coefficient at the 0.05 significance level and one predictor,bty_avg(p-value = 0.052), does not. However, the coefficient forbty_ageis very close to 0.05. - For males,
 , so the estimated regression equation is
  .
. - We expect
scoreto increase by 0.0600 for each additional one-unit inbty_avg, holding gender fixed. This interpretation is the same for males and females. - Given that the coefficient for
bty_avgis slightly above 0.05, the model accounts for only 8.55% of the variation inscore, and the average increase inscorefor a one-unit increase inbty_avgis only 0.0600, the association betweenscoreandbty_avgin this model is not really of much practical significance. Other factors not considered here are likely to be of much greater relevance.
