Lesson 1.1 Organizing Data

Lesson Learning Objectives
- Describe in very general terms what statistics is all about.
- Identify the “who, what, when, where, why, and how” of data.
- Define what is meant by a variable in statistics.
- Identify a variable as categorical or numerical.
- Distinguish between the name of a variable and the values that a variable can assume.
- Identify the units used for a numerical variable.
Lesson 1.1 Checklist
| Learning activity | Graded? | Estimated time |
|---|---|---|
| Read OpenIntro Statistics sections 1.1 and 1.2 and supplementary notes | No | 30 mins |
| Watch instructional videos | No | 15 mins |
| Answer two lesson check-in questions | Yes | 15 mins |
| Work through virtual statistical software lab | No | 45 mins |
| Answer two virtual statistical software lab questions | Yes | 15 mins |
| Work on practice exercises | No | 1.5 hours |
| Explore suggested websites | No | 15 mins |
Learning Activities
Readings 📖 and Instructional Videos 🎦
Textbook Overview
Read the Preface in the OpenIntro Statistics (Diez et al., 2019) textbook CC BY-SA 3.0. Yes, really 😁. There’s useful information here that will benefit you as you move through the course. In particular, you’ll see a good overview of the topics covered in the course and learn how examples and guided practice exercises are woven into the text. Answers to guided practice exercises are provided in footnotes at the bottom of the page.
Introductory Case Study
Read Section 1.1 Case Study: Using Stents to Prevent Strokes in OpenIntro Statistics (Diez et al., 2019) CC BY-SA 3.0. This application provides a good motivation for why you’re studying statistics. Self-assess your understanding while you read by attempting the guided practice exercise.
Watch the video, Case Study: Using Stents to Prevent Strokes (Barr & McGovern, 2013) (duration 00:04:29):
Data Basics
Read Section 1.2 Data Basics in OpenIntro Statistics (Diez et al., 2019) CC BY-SA 3.0. Here you’ll learn how to effectively organize and describe data prior to analysis. As you read, look up new terminology in the Glossary and self-assess your understanding by attempting the guided practice exercises.
Watch the video, Data Basics: Observations, Variable, and Data Matrices (Barr & Diez, 2013), to reinforce your learning (duration 00:04:14).
The 5 W’s Plus H: Who, What, When, Where, Why, and How
Read Supplementary Notes 1.1, for a good summary of the textbook readings, and you’ll also learn about the “5 W’s plus H.”
Lesson Check-in Questions ✍
Virtual Statistical Software Lab 💻
Work through the virtual statistical software lab: Software Lab 1.1: Introduction to jamovi. This will introduce you to jamovi, which is free, easy-to-use, open source software for conducting statistical analysis. You’ll be using this software to carry-out all the statistical analyses covered in the course. This lab will show you how to download and run the software. You will explore readings on data and learn basic commands for working with data in jamovi.
As you work through the lab, answer the exercises in the shaded boxes. These exercises are not graded, but the solutions are available: Software Lab 1.1 Solutions. The lab should take you no more than 45 minutes to complete.
Virtual Statistical Software Lab Questions ✍
Practice Exercises 🖊
Work on the following exercises in OpenIntro Statistics: Exercises 1.1, 1.3, 1.5, 1.7, 1.9, and 1.11 and Chapter Exercise 1.43 (Diez et al., 2019) CC BY-SA 3.0. Check your answers using these solutions (Diez et al., 2019) CC BY-SA 3.0. You’ll deepen your understanding much more effectively if you genuinely attempt the questions by yourself before checking the solutions.
Work on the practice questions in the WeBWorK platform, which are linked from your Moodle course. Check your answers using the solutions provided.
Suggested Websites 🌎
The following online resource covers much the same topics as this course, so take a look any time you’d like an alternative perspective. Online Statistics Education: An Interactive Multimedia Course of Study (Lane, n.d.), by Project Leader David M. Lane at Rice University.
If you get stuck using the jamovi statistical software for this course, check-out Community Resources for Jamovi (jamovi, n.d.) for additional help.
Media Attributions
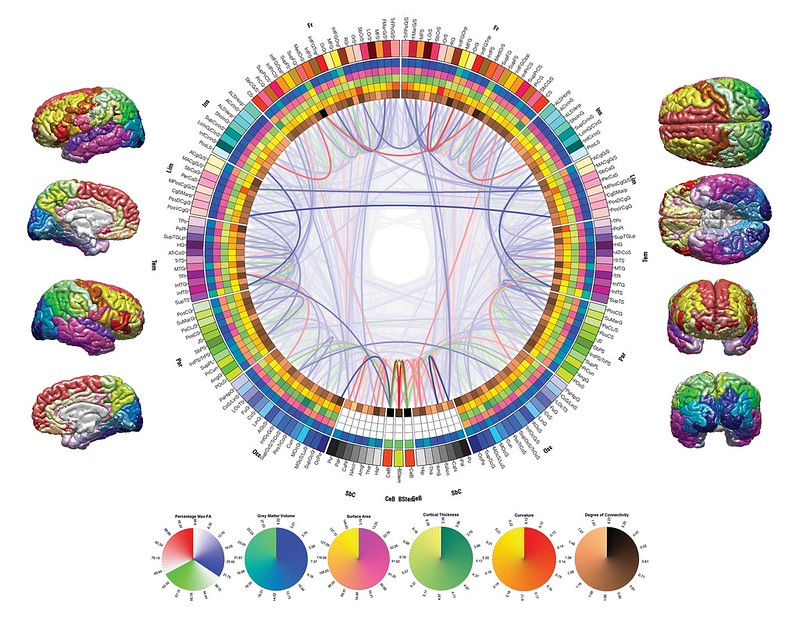
Brain Art, by John Van Horn (2012), via Ars Electronica on Flickr, CC BY-NC-ND 2.0
References
Ars Electronica. (2012, Aug. 13). Brain art [Digital artwork]. Flickr. https://www.flickr.com/photos/arselectronica/7773462744/
Barr, C. D., & Diez, D. [OpenIntroOrg]. (2015, May 19). Data basics: Observations, variable, and data matrices [Video]. YouTube. https://youtu.be/Mjif8PTgzUs
Barr, C. D., & McGovern, S. [OpenIntroOrg]. (2013, May 5). Case study: Using stents to prevent strokes [Video]. YouTube. https://youtu.be/nEHFF1ADpWE
Diez, D. M., Çetinkaya-Rundel, M., Barr, C. D. (2019). OpenIntro Statistics (4th ed.). OpenIntro. https://www.openintro.org/book/os/
jamovi. (n.d.). Resources by the community. https://www.jamovi.org/community.html
Lane, D. M. (n.d.). Online statistics education: A multimedia course of study. http://onlinestatbook.com/
Van Horn, J. D., Irimia, A., Torgerson, C. M., Chambers, M. C., Kikinis, R., & Toga, A. W. (2012.) Mapping connectivity damage in the case of Phineas Gage. PLoS ONE 7(5): e37454. https://doi.org/10.1371/journal.pone.0037454

